An example of using LiveWire Virtual, LiveNX, and Omnipeek
A web-based version of LiveAction’s Omnipeek Network Analysis Software is available from LiveNX. You can easily start and use Omnipeek whenever you identify an interesting alert or flow in LiveNX that needs further investigation and you want to analyze the packet level details more closely in Omnipeek.
NOTE: Omnipeek can be used independently of LiveNX, directly from the LiveWire Virtual appliance by entering the IP address of the LiveWire Virtual appliance into a web browser.
For example, a user on your network experiences poor call quality during a portion of their teleconference meeting. Since you have LiveNX and are populating it with both NetFlow from infrastructure routers as well as LiveFlow from LiveWire Virtual appliance, you can visualize any flow, including this teleconference call, from end to end.
Since the user did not want to disrupt their meeting to report the issue, you find out after the call has ended that the user experienced problems. Based on the user’s information, you can quickly find the flow in LiveNX and see critical metrics regarding the call, including jitter and latency. The screen below shows alerts generated by LiveFlow sent from LiveWire Virtual.
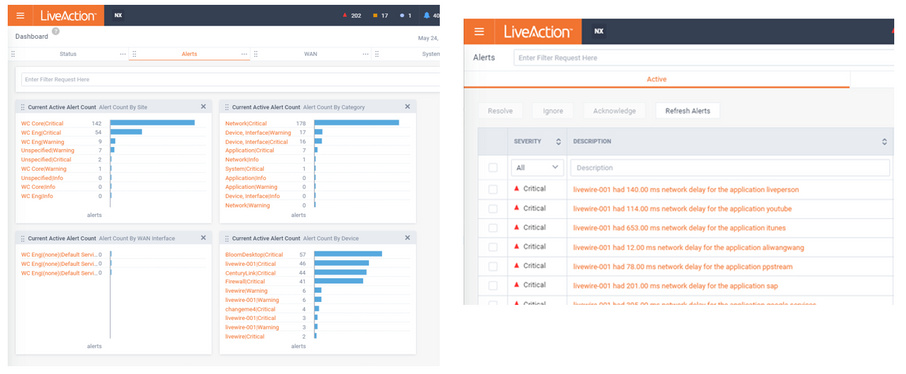
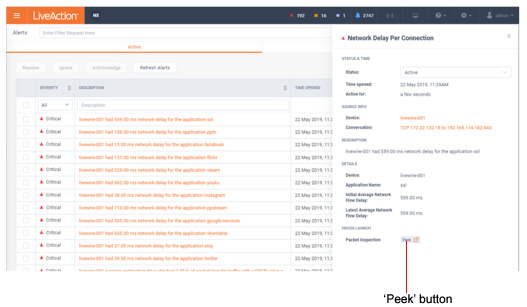
You also notice that an alert was triggered for excessive delay. This alert confirms the user’s report, but you’d like to dig in even deeper to perform a root cause analysis of the issue. The best way to do this is with the network packets themselves, and since this call was captured by a LiveWire Virtual appliance you can simply click the ‘Peek’ button with the alert and immediately see all of the network packets for that teleconference session.
When the Peek button is clicked to cross-launch to packets, a new tab will open in the browser, and a Forensic Search dialog will appear with various options. This allows you to perform detailed analysis on the call in Omnipeek and determine exactly when the jitter was bad, and correlate that with other activity on the network, to determine the root cause.
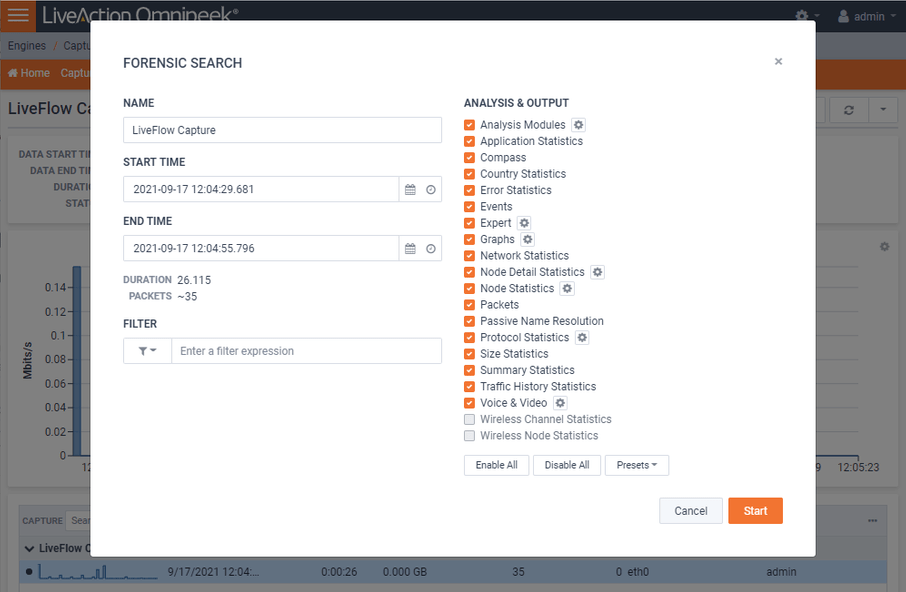
The default filter in the Forensic Search dialog includes the source and destination IP addresses of the flow. The filter can be changed to include more packets in the result, providing insight into what other traffic may be related or affecting the quality of the flow in question.
The time range can be adjusted to include more (or less) packets. This can work in conjunction with the filter, which when widened, will include more packets from the other flows between the source and destination IP.
The Analysis & Output options are used to include more or less analysis. The less analysis, the faster the forensic search will be. For example, if all you want are the packets, to load into Omnipeek, then just enable the packets option. Multiple forensic searches can be performed at the same time, and left running for others to use collaboratively. Keep in mind that a forensic search exists on the appliance, using memory and hard disk. When you are done using a forensic search it should be deleted.
The screen below shows various analysis views in Omnipeek which are good places to start understanding the problem as well as drill-down to the packets view.
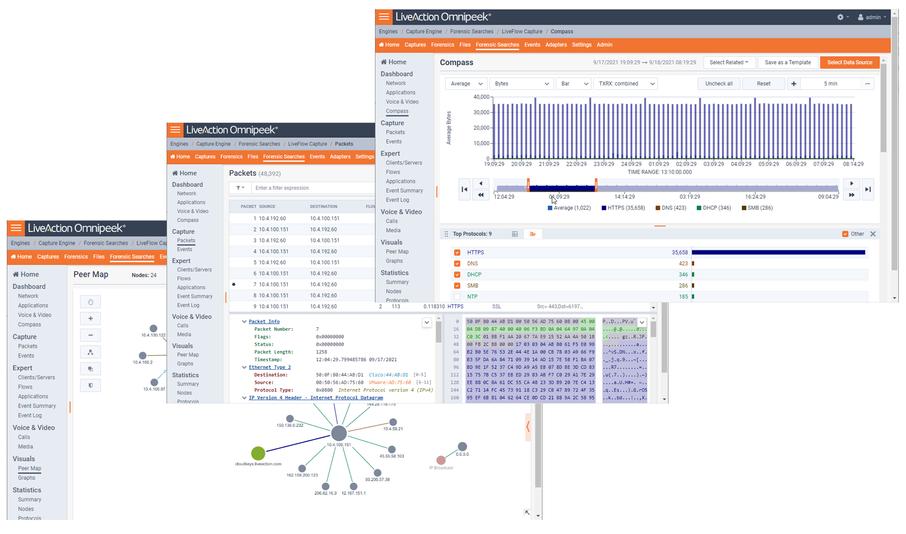
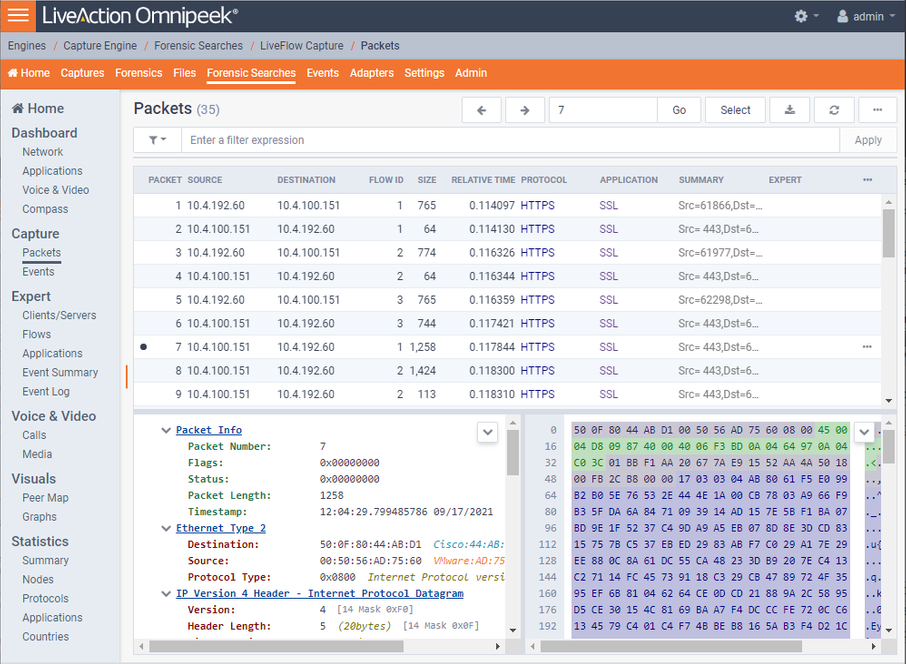
The screen below shows the Packets view in Omnipeek which displays the list of packets and various other details about them, including the Experts, decode, and Hex view for each one.